Debugging/Troubleshooting Tools
In this document, you will learn about some troubleshooting tools that will help you capture network browser logs, make a screencast, and find out the browser version you are using.
Collecting this information will be helpful for further investigation of the issue you are facing with your website and help us quickly identify the exact behavior you are experiencing.
Capture Network Browser logs
If you face any issue on your web application while performing any action, you want to capture the error, logs, and API calls made while experiencing the problem.
You can use the step-by-step guide to capture the network logs and share them with the LoginRadius team. The network logs assist the team in troubleshooting the reported issues quickly and help us identify the root cause.
Google Chrome
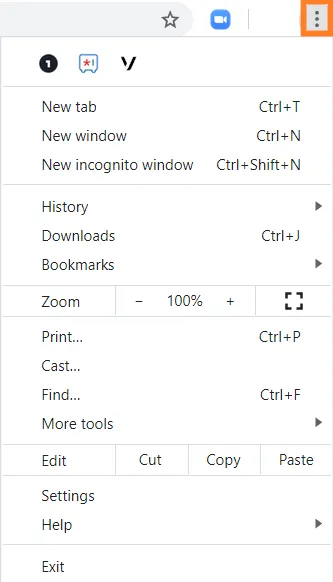
1. In Chrome, go to the page within the web application where you are experiencing trouble. At the top-right corner of your browser window, to expand the Settings menu, click the Chrome menu (⋮) or press F12 key on keyboard to open Developer tool.
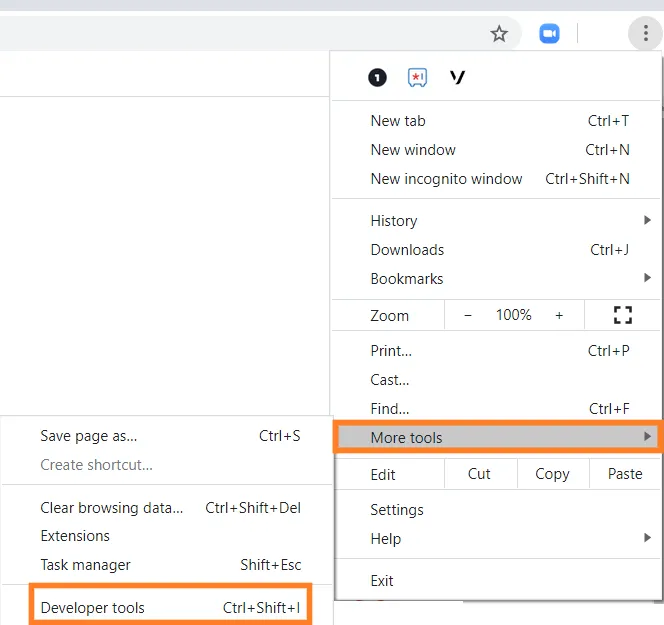
2. From the Settings drop-down menu, select More Tools and then Developer Tools from the pop-out menu that appears.
Note: Depending on your browser settings and whether or not you've used developer tools previously, the developer tools may show up on the side or the bottom of the browser.
3. In the developer tools window, select the Network tab. The logs you will want to collect are the Network and Console. The red circle icon to the far left indicates that you are recording network data.
4. Reproduce the issue and then press the red circle(Record network log button), or** Ctrl + E**, to pause recording the network data. The circle will turn grey, indicating that it has stopped recording.
5. Capture the network trace:
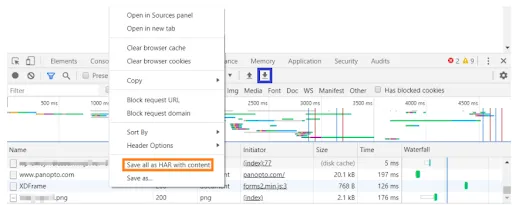
Right-click in a white space in the bottom section, where the Name, Status, Type, Initiator, Size, Time, and Waterfall sections appear. From the menu that appears,click on the export button as shown in a picture or select** Save all as HAR with content** as given in the following screen. Once selected, the Save As window will appear. Pick a name and location on your machine, and then choose Save.
6. To Capture the Console log:
Select the Console tab and right-click in a white space. From the menu that appears, select Save As as given in the following screen. Once selected, the Save As window will appear. Pick a name and location on your machine, and then choose Save.

7. Capture Logs For Pop-up:
If you are looking to capture the logs for workflows where the pop-up window is involved, please follow the below steps in Google Chrome:
1. Press F12, and go to Network, click on Gear icon at the top right.
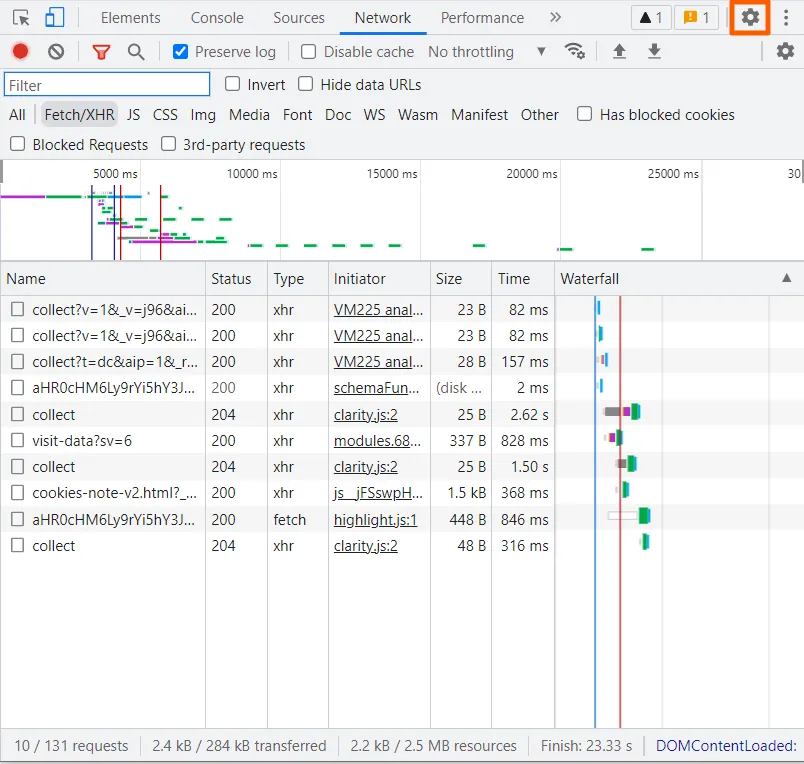
2. Scroll down to Global, and enable Auto-open DevTools for popups.
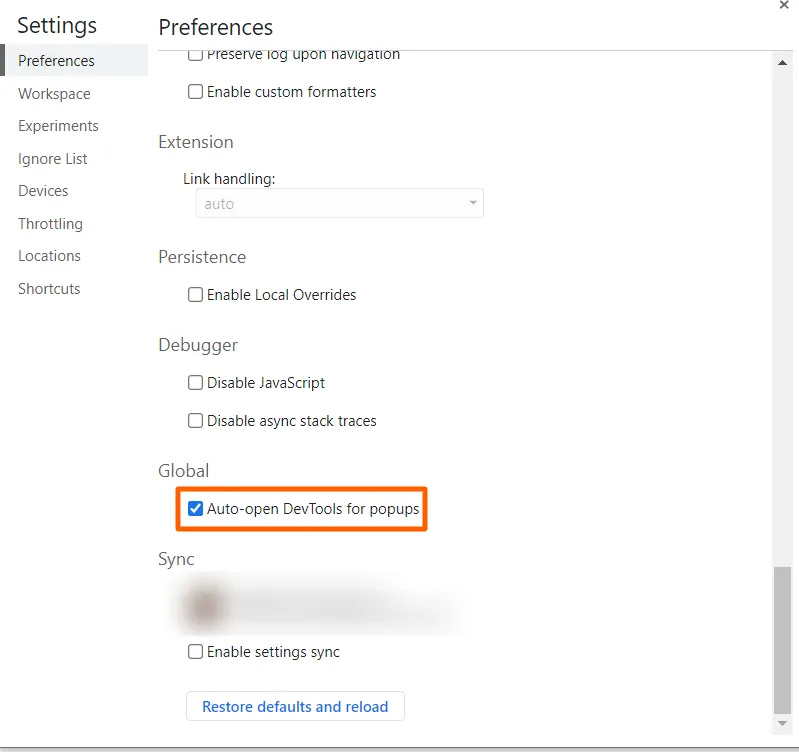
3. Now you can capture the network log as shown above in this document.
Firefox
1. In Firefox, go to the page within the web application where you are experiencing trouble.
2. Click the Firefox menu (three rows) at the top-right of your browser window or press F12 key on the keyboard to open the Developer tool.
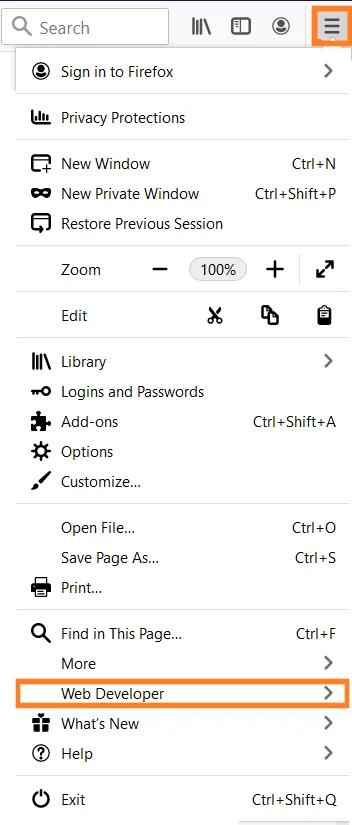
3. Select Web Developer > Network.
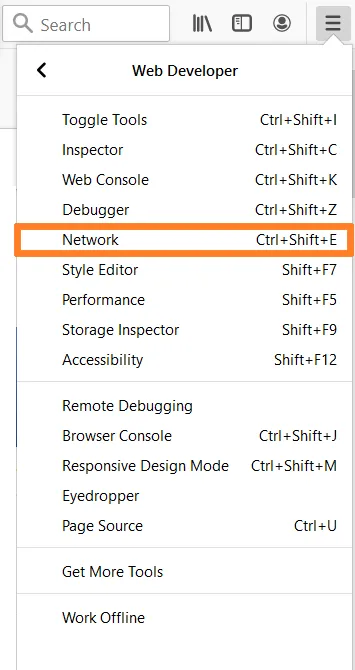
4. The Developer Tools window opens as a docked panel at the side or bottom of Firefox.
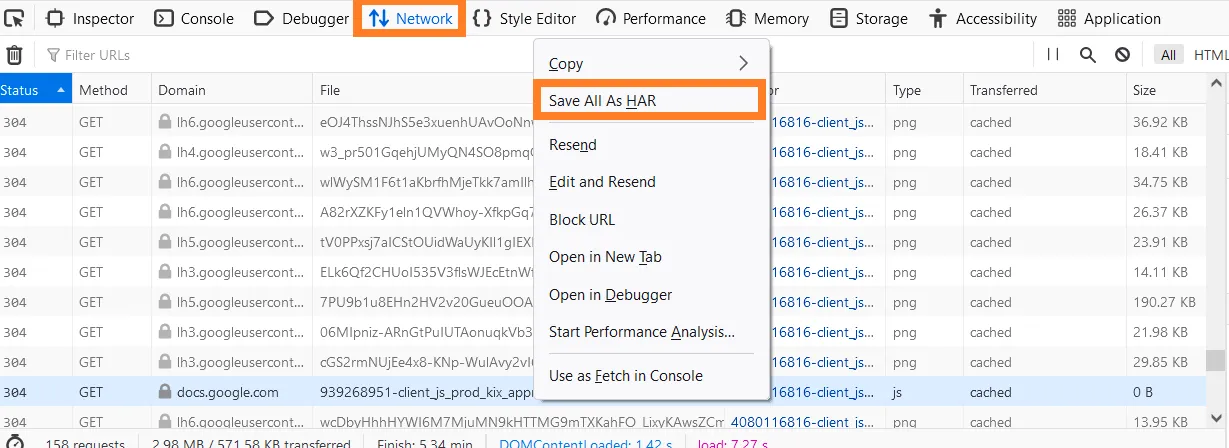
5. Click the Network tab.

6. Select Persist logs.

7. Refresh the page and reproduce the problem while the capture is running.
8. After you successfully reproduce the issue, right-click any row of the activity pane and select Save all as HAR.
9. Select the Console tab.
10. Right-click any row and select Select all.
11. Paste the content in a text file and name it console-log.txt.

12. Send both files as shared links in a reply to your case.
Internet Explorer (IE11)
1. In Internet Explorer, go to the page within the web application where you are experiencing trouble. 2. Click the gear icon in the top right. 3. Select F12 Developer Tools or press F12 key on keyboard to open Developer tool.
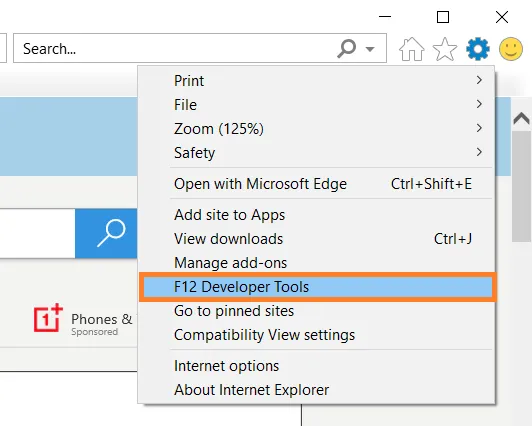 4. Click the Network tab.

5. Clear the Clear entries on the navigate option, which is selected by default. The icon looks like a blue arrow with a red X.
6. The green play button (Start Profiling Session) is selected by default. It means the capture function is running.

7. Refresh the page and reproduce the problem while the capture is running.
8. Once you have reproduced the issue, click the Export as HAR icon. The icon looks like a floppy disk.

9. Click the Console tab.
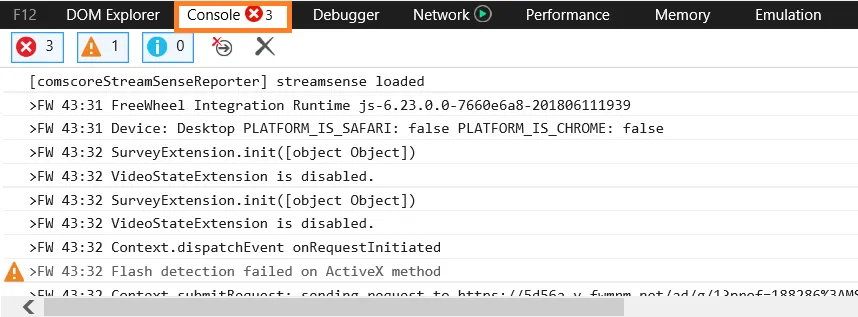
10. Right-click any row and select Copy all.
11. Paste the content in a text file and name it console-log.txt.
12. Send both files as shared links in a reply to your case.
Edge
1. In Edge, go to the page within the web application where you are experiencing trouble.
2. At the top-right of your browser window, click the Edge menu (⋮) or press F12 key on keyboard to open Developer tool.
3. Select More Tools >Developer Tools
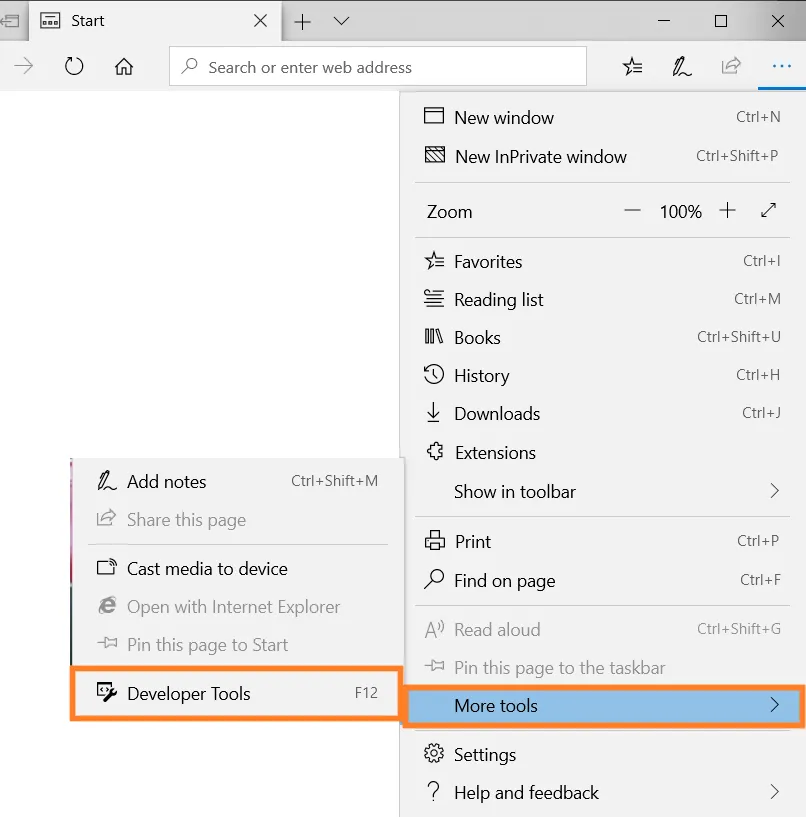
4. If the network tab is not present click on the three horizontal buttons on the developer console->More Tools->Network to enable the network.

5. Click the Network tab.
6. Clear the Clear entries on the navigate option, which is selected by default. The icon looks like a blue arrow with a red X.

7. The green play button (Start Profiling Session), should be selected by default. It means the capture function is running.

8. Refresh the page and reproduce the problem while the capture is running.
9. Once you have reproduced the issue, click the Export as HAR icon. The icon looks like a floppy disk.
10. Click the Console tab.
11. Right-click any row and select Copy all.

12. Paste the content in a text file and name it console-log.txt.
13. Send both files as shared links in reply to your case.
Safari
1. In Safari, first ensure your Develop menu is available navigating to the menu bar and selecting Preferences > Advanced: "Show Develop menu in the menu bar"
2. Go to the page within the web application where you are experiencing trouble.
3. In the menu bar at the top, keyboard shortcut Option+Command+i or click Develop and select Show Web Inspector.
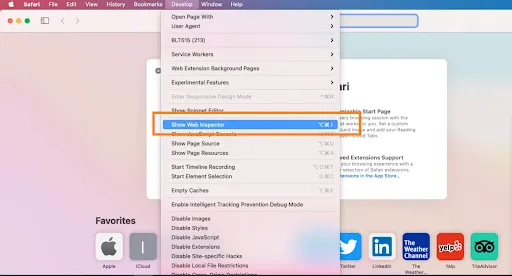
4. Click the Console tab and select Preserve Log.
5. Go back to the Network tab.
6. Refresh the page and reproduce the problem while the capture is running.
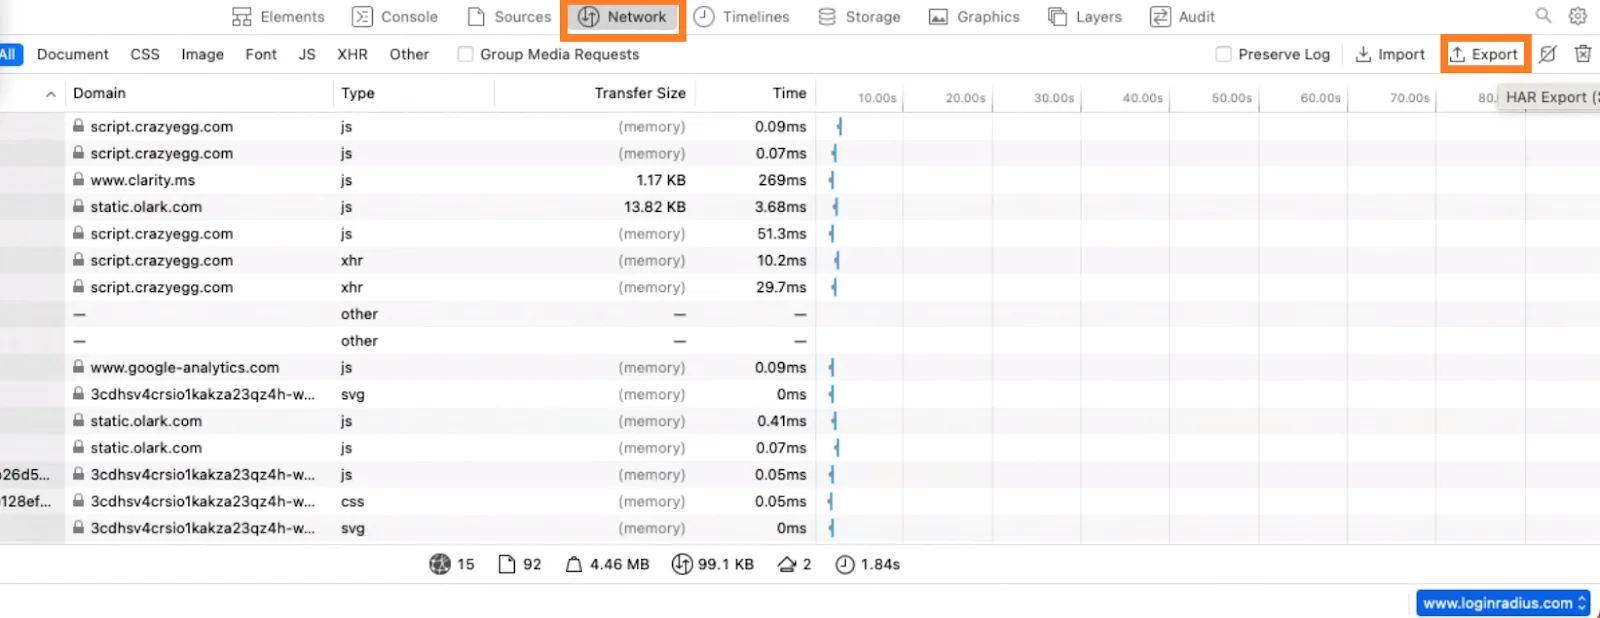
7. After you successfully reproduce the issue, right-click any row of the activity pane and select Export HAR.
8. Click the Console tab.
9. Drag and Select all logs ,Right click on selected logs

10. Click on Save selected option from the menu popping and download the console.txt file.
11. Send both files as shared links in reply to your case.
Capture video screen
To record the actions made on your web application screen, you can use lots of available extensions like Loom, Awesome Screenshot, Vidyard, etc.
Note: We do not partner with these extensions and aren't responsible for any issues caused by these apps.
Learn how to capture the screen using the Loom extension and to record your voice and video as you explore your site or application with Chrome.
Creating detailed bug reports can be difficult, especially when it comes to writing long step-by-step instructions. Quick videos are a fast way to document and understand what is going on with your website or application and fix them.
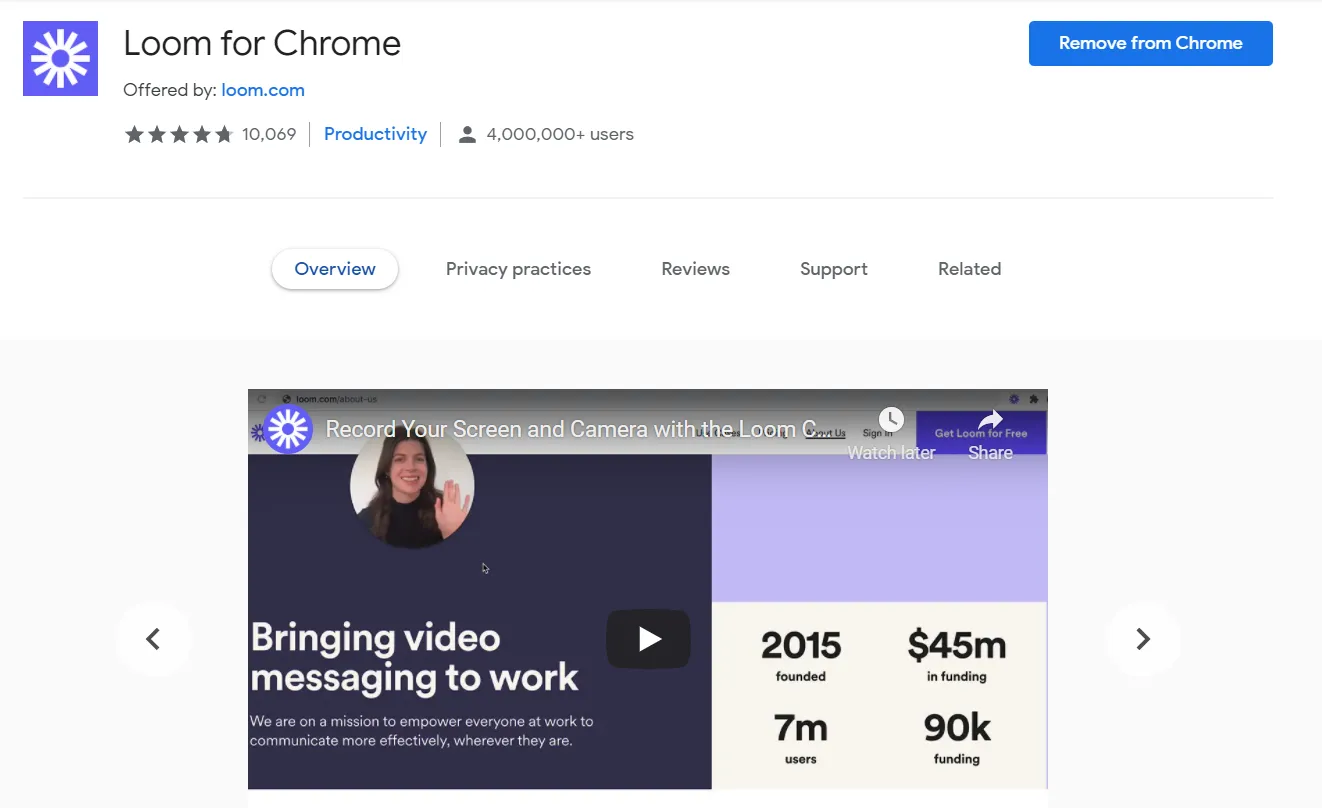
Loom allows you to record your browser window and accompanying audio and video as you browse a site in Chrome.
Check the following steps.
1. Open your Chrome browser.
2. Now Install the Loom Chrome extension.
3. After that, create an account at www.loom.com.
4. Let’s open the website you want to record.
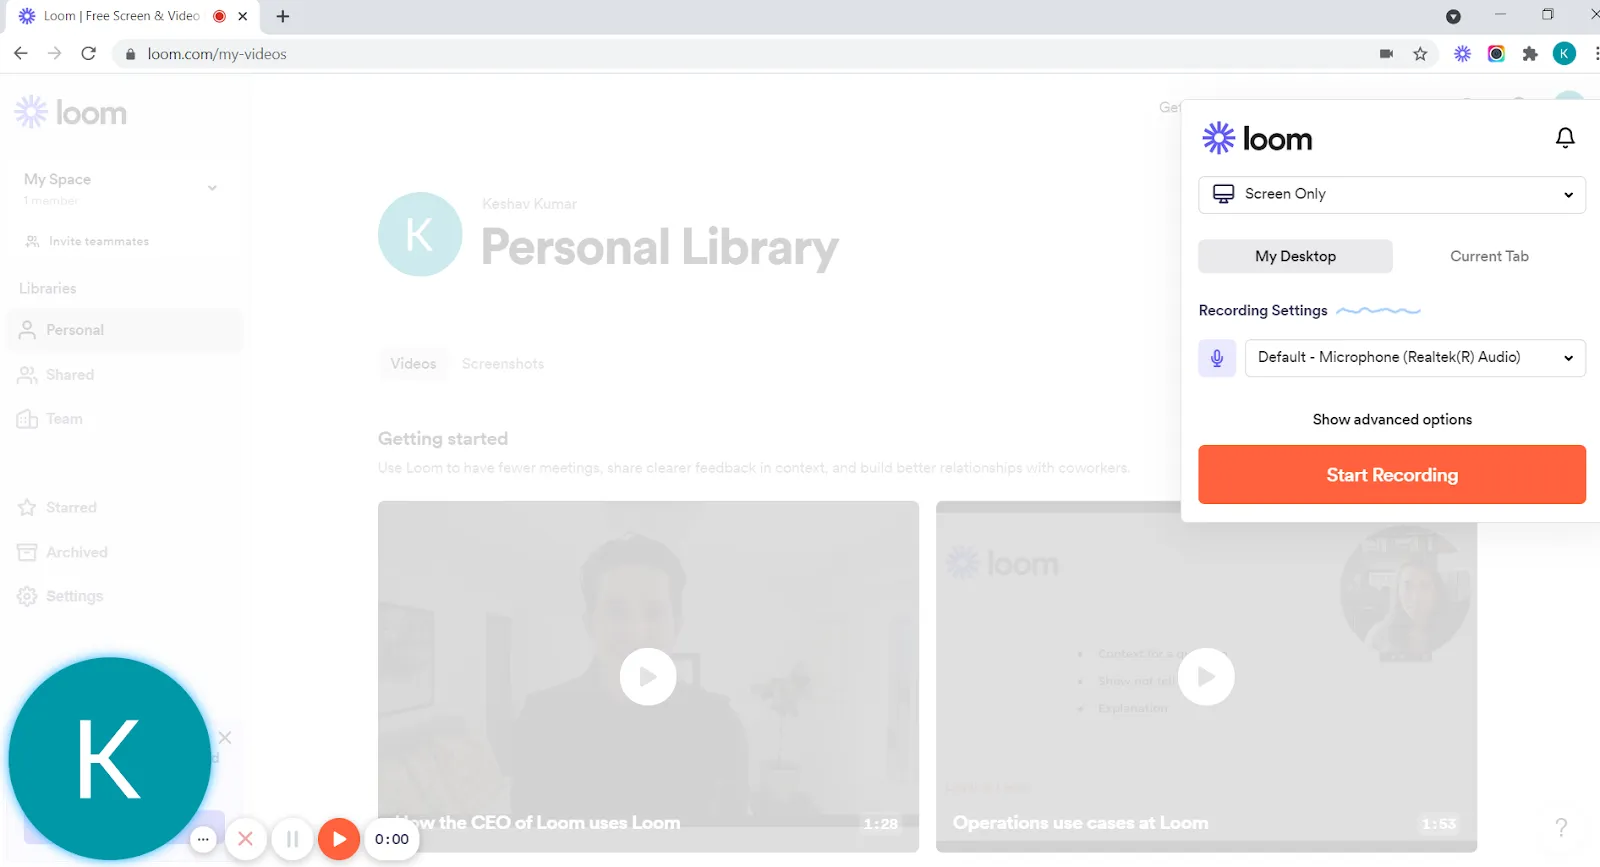
5. Select the Loom extension: choose the available option for recording (Screen Camera, Screen only)

6. Click on Start Recording. You're now recording a video of the site with audio from your microphone.

7. Select the circle in the lower left of the browser to turn on your webcam.
8. Now, you're recording your face from the webcam, and you can end or cancel the recording just using the options available beside it.
9. Select the Loom extension again.
10. Recording ends.
11. See all of your recorded videos at https://www.loom.com/my-videos.
Check your browser version.
To quickly check the information regarding the browser you are using and know whether your browser is up to date?
Find these details and more information swiftly! And you can share the details with the support team for further investigation when facing some challenges with your site or web application.
Note: We do not partner with this website and aren't responsible for any issues caused by it.
Check the following steps to get the information quickly.
- Open the browser on which you are facing the issue.
- Now visit https://www.whatismybrowser.com/ on it.

- You will get the browser information on the top of the page, and just below, copy the link available under Your web browser's unique URL.

- Send this link to the support team to share information about your system details & configuration.