User Analytics gives a clear picture of who your users are and how they sign in. Track sign-ups, demographics, and login patterns across providers, browsers, devices, and regions, all without any setup.
Access: Admin Console → Insights → User Analytics. The dashboard is split into Identity Analytics (the state of your user database) and Login Analytics (login behavior).
Analytics
The dashboard is split into two views: Identity covers the state of your user database (who exists, who's new, demographic, browser, device, and region breakdowns), while Login covers login behaviour (frequency, providers, devices, and return rate).
Identity
Login
Overview
Headline counts of accounts, profiles, blocks, and deletions across the selected range.
Total Users
Cumulative growth of registered accounts over time. Hover any point on the line to see the exact User Profiles total on that date.
User Growth
Period-over-period change, sign-ups, profile completions, blocks, and deletions during the selected range. The chart overlays two series: New (blue) and Deleted (red).
Identity Provider
Methods users picked to register or log in: Email/Password, Google, Facebook, Apple, or enterprise SSO. Use it to optimize your login experience by emphasising the most-preferred methods.
Age Group
Distribution of users across age ranges, useful for tailoring content and interface design for different demographics. Unknown captures users without a birthdate on file.
Browser
A donut of the most common browsers used to access your platform. Helps ensure your front end is optimized for the most-used platforms.
Device
Whether users primarily access your platform via Desktop, Mobile/Tablet, or other devices. Useful for guiding design and feature decisions across screen sizes.
Region
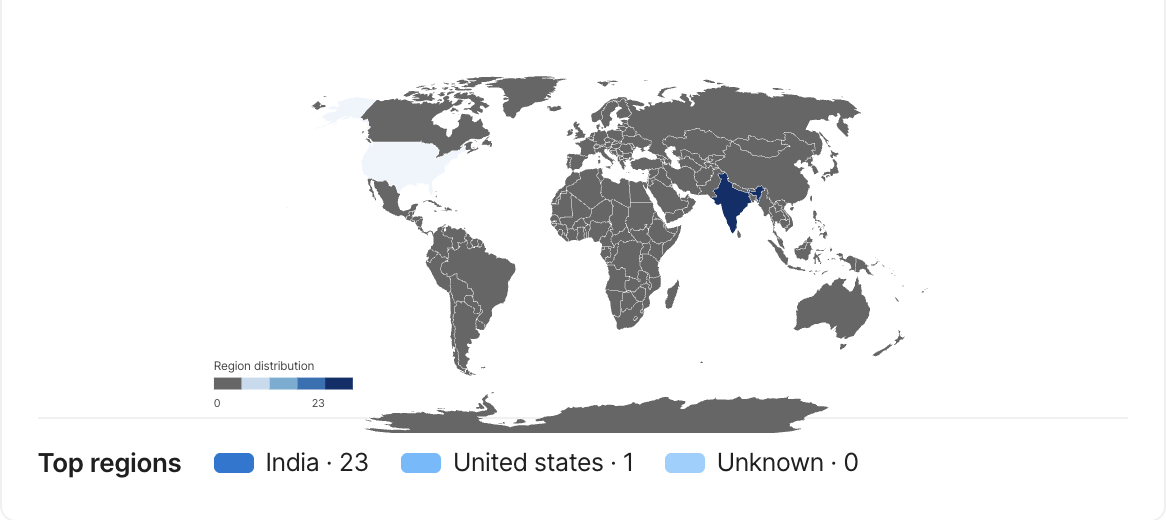
A geographic view of user distribution. Surfaces top regions for location-based customization, localization, and market focus.
Gender
A breakdown of user gender data (if collected). Useful for personalized experiences and inclusive design decisions.
Overview
Top-line login metrics: total volume, first-time logins, and the dominant identity provider in the selected window.
Login Activity
Daily login activity over the selected period. Quickly spot weekday rhythms, spikes from campaigns, or dips that may signal an outage.
Active Users
Two complementary views of engagement: DAU tracks unique users per day. MAU tracks unique users per month for reporting and billing accuracy.
Daily Active Users
Monthly Active Users
Identity Provider
A donut showing how logins split across providers. Helps identify which login methods are most popular, and which buttons should appear first on the sign-in page.
Browser
Each browser's percentage of logins. Useful for browser compatibility testing and prioritization.
Device
How many logins originated from Desktop, Mobile/Tablet, or other devices. Helps optimise performance and design based on the dominant platforms.
Return Rate
The average number of times a user returns and logs in, broken down by identity provider. Example: Email users log in on average 2.1 times during the period. Useful for understanding stickiness and login behaviour per provider.
Best practices
Use filters smartly
Apply date ranges, domains, or profile types to narrow your analysis scope.
Encourage profile completion
More detailed user data improves segmentation and reporting.
Watch for anomalies
Unusual spikes in blocked or deleted users may signal system issues or abuse.
Track trends regularly
Weekly or monthly check-ins help identify what's working or needs improvement.
Export and share
Most charts are exportable for team reporting or deeper data work.