Authentication systems tend to look straightforward when you first design them.
A request comes in, credentials are validated, maybe an MFA challenge is triggered, and a decision is returned. From the outside, this reduces cleanly into a binary outcome: success or failure.
You log the outcome, attach some metadata, and if something goes wrong, you inspect the logs.
Most teams follow this pattern, and so did we.
But over time, authentication flows stopped being single-step interactions. And that’s majorly because of our own product innovations.
We introduced:
-
Advanced login methods (Magic links, OTP, passwordless)
-
Adaptive checks based on context
-
Policy-driven access decisions
-
Multi-factor authentication
And so on…
Individually, each addition was important from the end-user security point of view and made complete sense. And collectively, they changed the shape of authentication entirely.
At the backend, from that point onwards, a “login” was no longer a single event. It was a sequence of decisions. But were we able to log them simply as a single binary outcome as we did before? And was just logging the data enough?
The answer is a clear “NO”.
And that’s where the cracks started to show - not in how authentication worked, but in how we analyzed, understood, and used the logged data.
We Had The Data, But It Lacked Usability!
One thing that’s worth calling out: we didn’t run into a lack of data. If anything, we had more visibility than before.
Every meaningful step emitted an event:
-
Login attempt initiated
-
Credential validation result
-
MFA challenge issued
-
MFA verification result
-
Policy evaluation
-
Final decision
From a logging standpoint, the system was behaving correctly.
But when we tried to answer simple questions, things became unexpectedly difficult.
Questions like:
-
Why are login failures increasing right now?
-
Are users struggling with MFA, or are they abandoning it?
-
Is a policy behaving as expected, or is it too restrictive?
These weren’t edge cases. They were questions that popped up frequently, and needed hours to answer. In short, they required more effort than they should have.
We Dug Up The Core Issue
The core issue was that we were modeling authentication as a collection of independent events.
But authentication isn’t independent. It’s sequential.
A single login attempt could look like:
-
User submits credentials
-
Credentials validated
-
Risk evaluation triggered
-
MFA required
-
MFA challenge sent
-
User responds (or doesn’t)
-
Final decision applied
Each step was logged separately.
Which meant if you wanted to understand the outcome of that login attempt, you had to:
-
Identify all related events
-
Correlate them based on timestamps or identifiers
-
Reconstruct the sequence manually
This worked in controlled debugging scenarios.
But it didn’t work:
-
in real-time
-
at scale
-
across multiple concurrent users
And it definitely didn’t work for teams who weren’t deeply familiar with the underlying system.
The Problem With “Status = Failed”
One specific issue kept surfacing repeatedly.
Different failure modes - completely unrelated in cause - were being represented identically in logs.
For example, all of these could result in:
But the reasons behind them were very different:
-
Incorrect password
-
Expired session
-
MFA not completed
-
Policy restriction
-
Suspicious activity block
From an operational standpoint, these require different responses.
But from a logging standpoint, they were indistinguishable unless you dug deeper.
So we tried to fix it the obvious way.
We added more metadata. Then more structured logging. Then layers of parsing on top of that. But even then, it was not perfect.
MFA Exposed the Gaps More Clearly
Multi-factor authentication made the limitations of this model much more visible. Before MFA, most login attempts were single-step. Failures were easier to reason about.
With MFA, a single login attempt became a multi-stage process:
-
Primary authentication
-
Challenge generation
-
Delivery (SMS, email, app, etc.)
-
User interaction
-
Verification
-
Timeout or retry handling
Each of these introduced:
-
latency
-
failure points
-
user-dependent behavior
And none of them were captured as a cohesive unit.
So we couldn’t answer:
-
Are users failing MFA verification, or not completing it at all?
-
Are certain delivery channels less reliable?
-
Is a spike in MFA failures due to user friction or system issues?
Again, the data existed - but the structure to interpret it didn’t.
Why External Analytics Didn’t Fully Solve It Either
The natural response to this kind of problem is to move analysis into a dedicated system.
We explored that path as well:
-
exporting logs into analytics pipelines
-
building dashboards
-
defining custom queries
This helped with aggregation, but it didn’t solve the underlying issue.
Because external systems don’t inherently understand authentication semantics.
They see:
-
events
-
timestamps
-
attributes
They don’t see:
-
flows
-
intent
-
decision context
So we had to recreate that meaning:
-
define what constitutes a “login attempt”
-
group related events
-
infer relationships
And this logic had to be maintained over time as authentication flows evolved.
Which introduced a new problem: drift.
The system generating the data and the system interpreting it were no longer aligned.
The Birth of Security Analytics - We Rethought the Model Instead of Extending It
At some point, it became clear that the issue wasn’t with tooling - it was with the model itself. We were trying to extract structured insights from unstructured representations. So instead of extending the existing approach, we stepped back and asked:
What if authentication analytics wasn’t something we derived later - but something we defined at the source?
That led to a few design decisions.
Design Principles That Guided the System
1. Represent outcomes with intent, not just state
A “failure” should carry a reason that doesn’t require interpretation.
2. Treat authentication as a first-class flow
A login attempt should be observable as a single unit, even if it spans multiple steps.
3. Keep context attached to the flow
MFA, policy decisions, and risk signals shouldn’t be detached from the main sequence.
4. Optimize for real-time understanding
If interpretation requires reconstruction, it’s already too slow for many use cases.
The Result - What Security Analytics Looks Like in Practice
Based on these principles, we changed how authentication signals are emitted and structured. And as a result, we created a single analytics dashboard that provides real-time visibility into every login event, MFA trend, and threat signal, without any additional effort, from day 1.
Failures Tell Their Reasons
Previously, a failed attempt was just that—a failed attempt. Everything downstream depended on interpreting it correctly.
We realized that if a failure requires interpretation, it’s already too late.
So instead of emitting a generic outcome and expecting something else to classify it later, we moved that responsibility upstream.
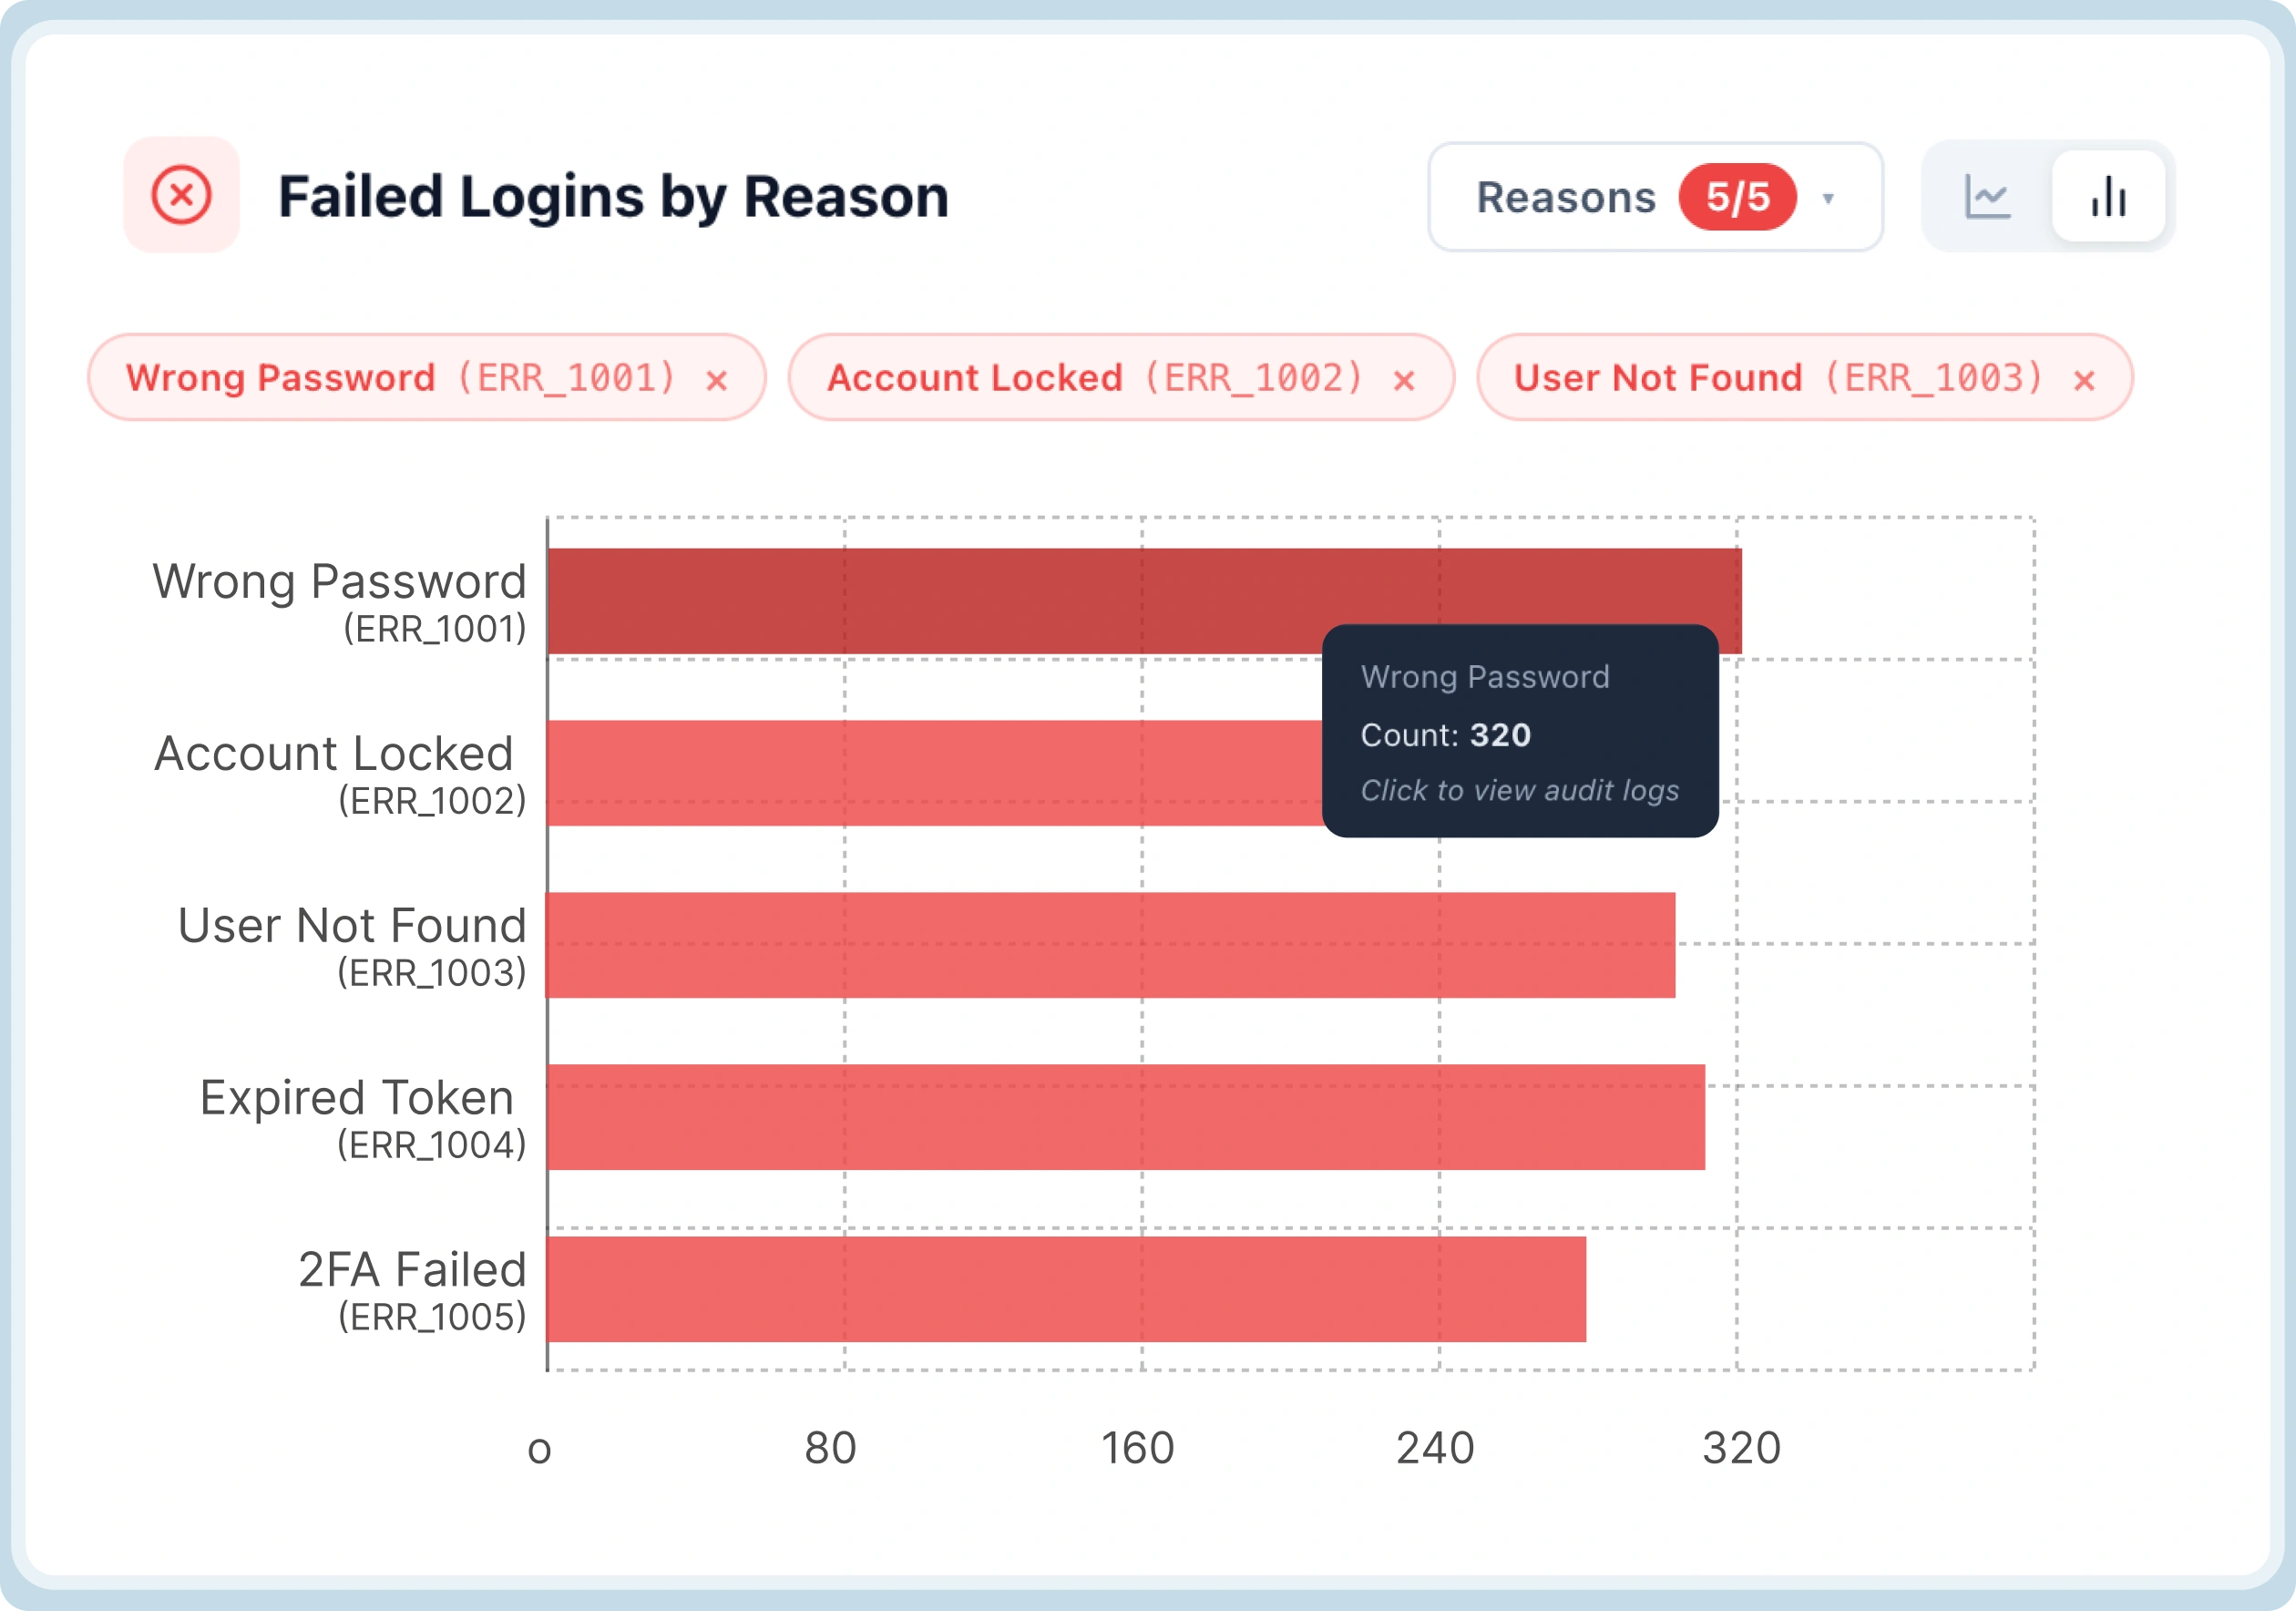
Failures are now categorized at the point where they occur.
That means the system doesn’t just say “this failed” - it says why it failed, in a way that doesn’t need to be reconstructed later.
Each failure is categorized explicitly into reasons like:
-
invalid credentials
-
MFA failure
-
policy enforcement
-
suspicious activity
This removes the need for downstream parsing and reduces ambiguity immediately.
Authentication as a Sequence
The second change was less about data and more about structure, and how we presented it.
We stopped treating authentication as a collection of independent events and started treating it as a single, continuous flow.
This sounds obvious in hindsight, but it changes how everything is represented.
Instead of looking at:
-
a login event
-
an MFA event
-
a policy evaluation
as separate records, they’re grouped into a single dashboard with a clear progression.
That makes it possible to answer questions that were previously difficult:
-
Where exactly did this attempt fail?
-
How far did the user get?
-
How long did each step take?
More importantly, it removes the need to rebuild that sequence every time in your mind whenever you want to understand it.
MFA as a Measurable Process
MFA was another area where the limitations of the old model were obvious.
Before this, MFA showed up as a checkpoint:
-
triggered
-
completed (or not)
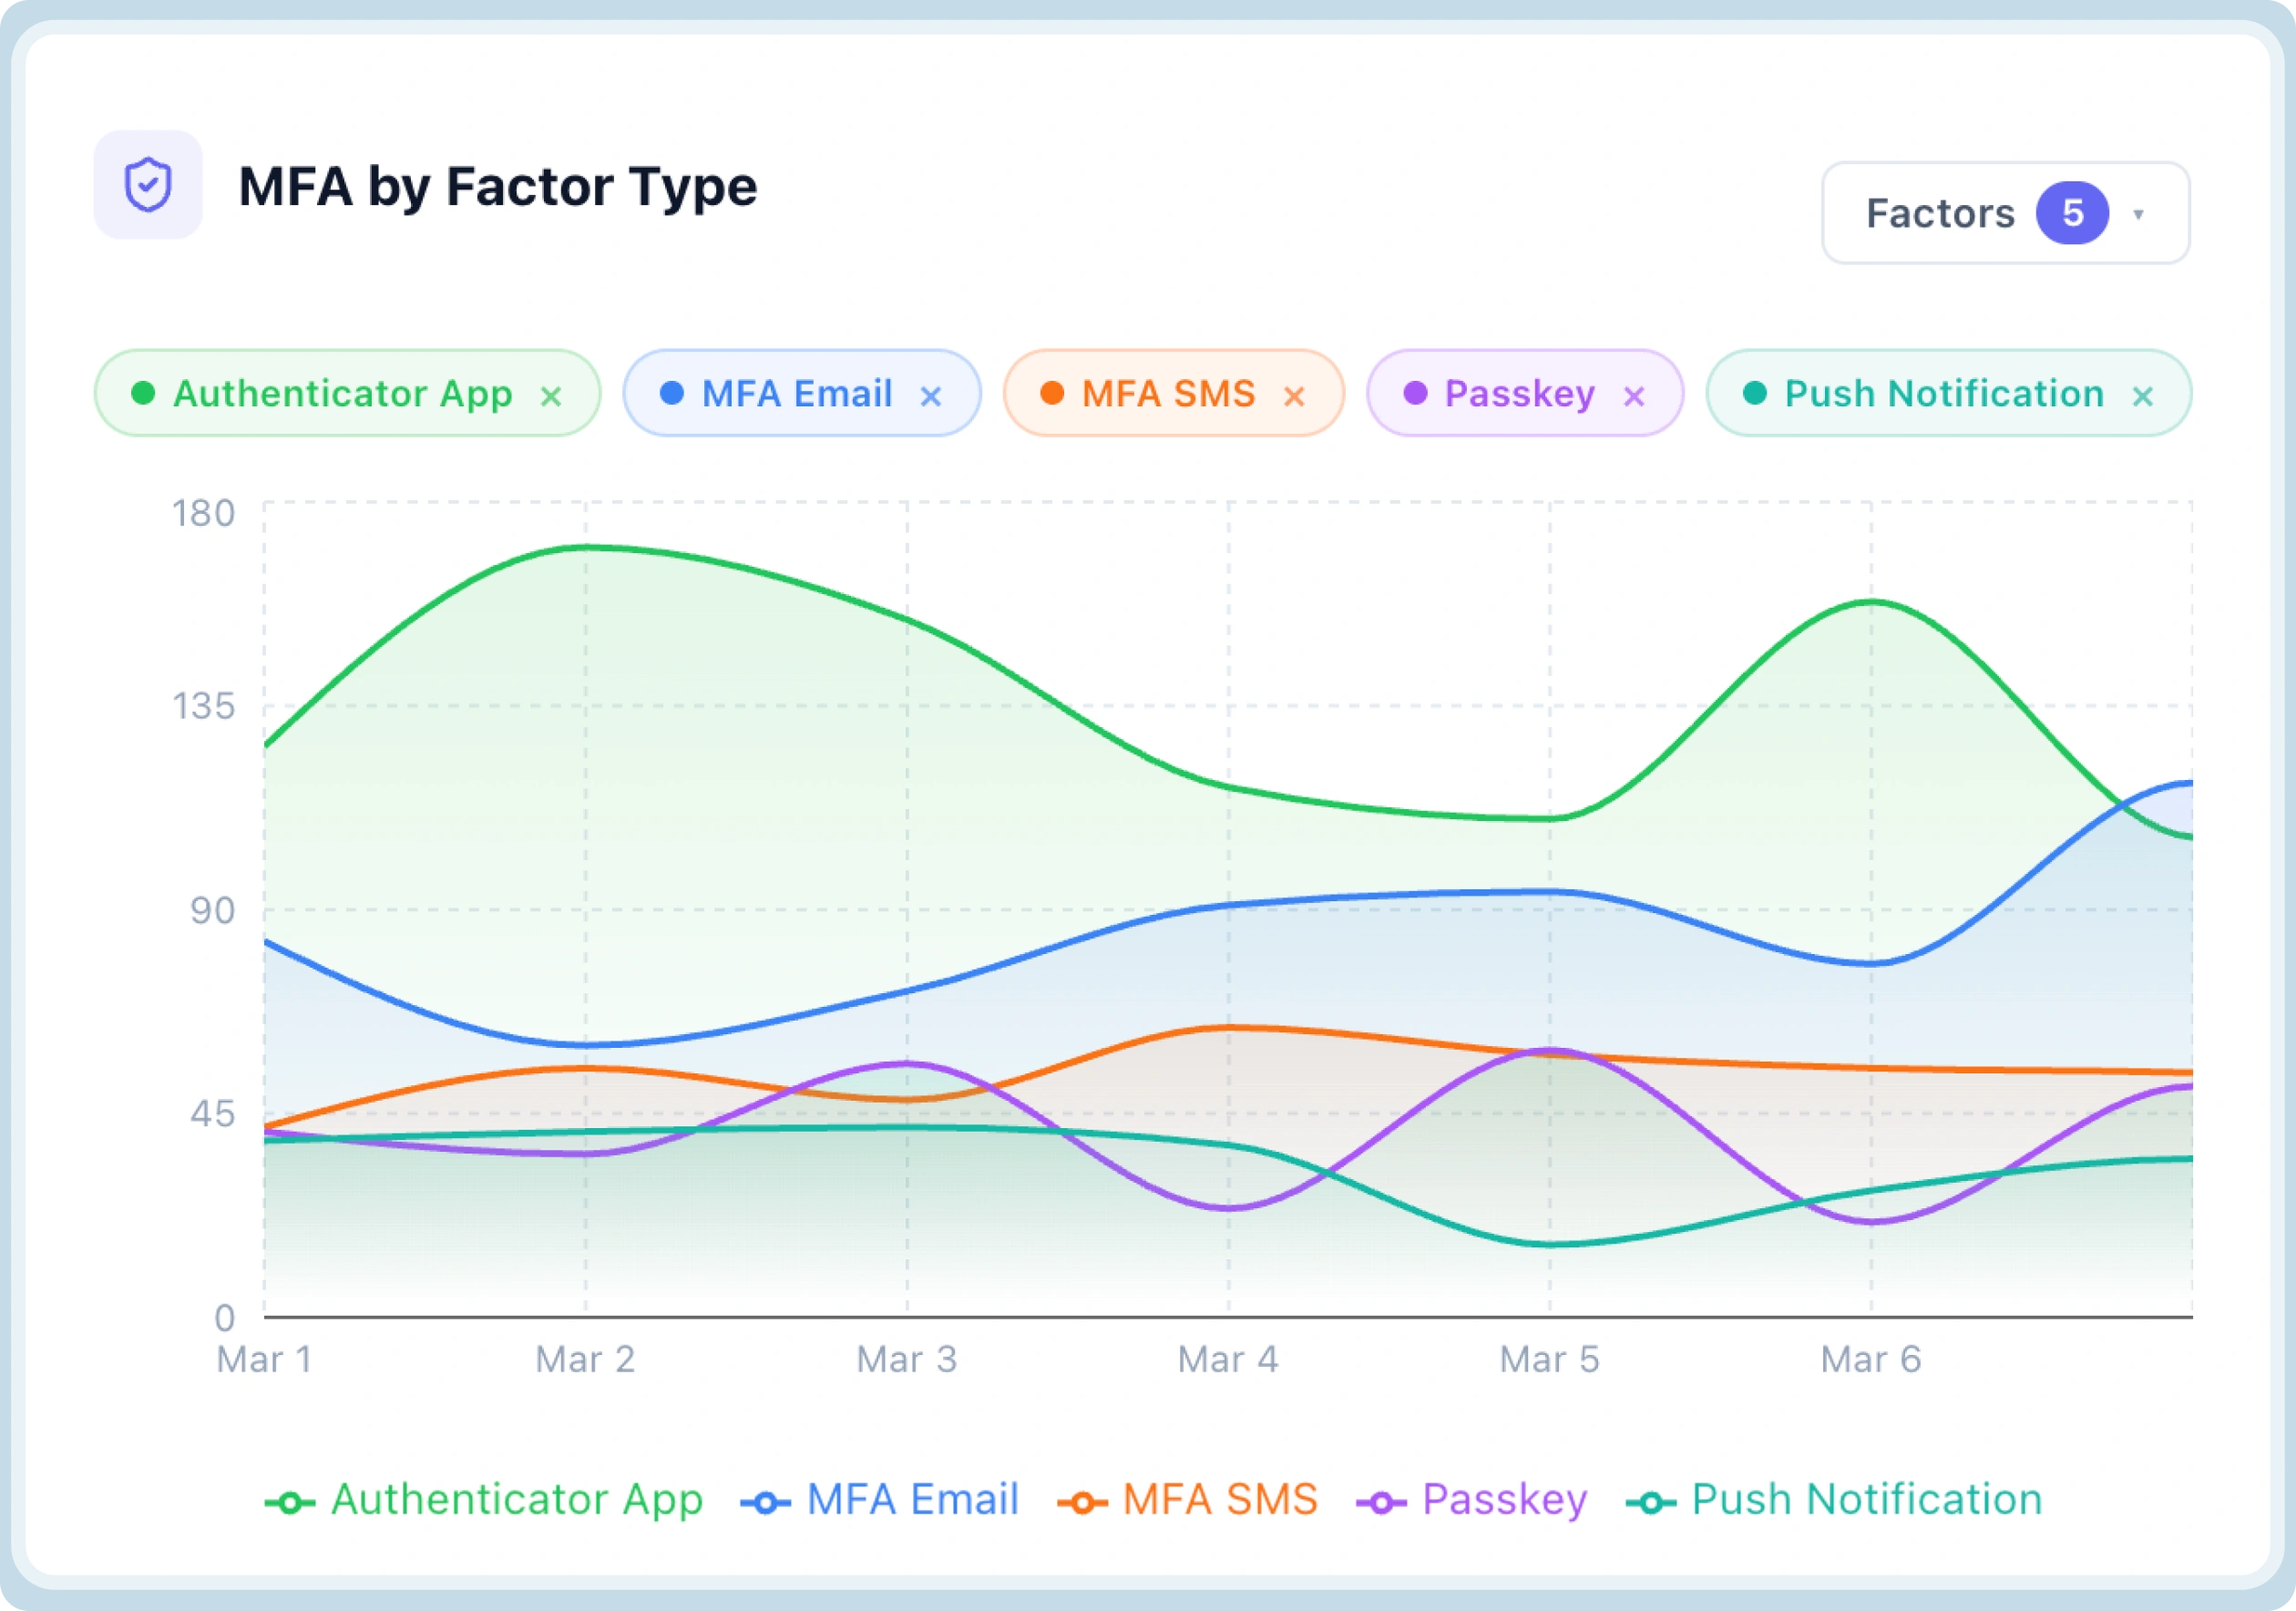
But that hides most of what actually matters. So we moved away from treating MFA as a binary checkpoint. And started treating MFA as its own process within the flow.
That includes:
-
how the challenge was initiated
-
which method was used
-
whether the user interacted with it
-
where the flow stopped
Currently, Security Analytics tells you:
-
method selection
-
challenge delivery
-
user interaction
-
completion or abandonment
This made it possible to distinguish between very different scenarios that previously looked identical:
-
a user struggling with the experience
-
a delivery issue
-
a genuine verification failure
Preemptive Breached Password Detection
Another gap we identified was around compromised credentials.
Traditionally, breached password detection exists as a separate check—often part of a security pipeline that runs alongside authentication, not within it.
Which creates a disconnect.
A login could technically succeed, while still being risky.
And the signal indicating that risk would live somewhere else:
-
in a different system
-
at a different time
-
often requiring manual correlation
We wanted to eliminate that separation.
So instead of treating breached password detection as an external signal, we embedded it directly into the authentication flow.
This means that when a compromised credential is used, it’s not just flagged—it’s contextualized.
You can now see:
-
where the exposure is happening (login, signup, password reset)
-
which users are affected
-
and how frequently it’s occurring
More importantly, this shifts the system from reacting to incidents to identifying risk at the point of entry.
Brute Force and Bot Activity as Observable Behavior
Automated attacks exposed a different kind of limitation.
They rarely appear as a single, obvious spike.
Instead, they show up as distributed patterns:
-
repeated attempts across accounts
-
low success rates
-
consistent retries over time
In traditional logs, this is difficult to interpret without heavy aggregation.
Even when detected, another question remains:
👉 Are your defenses actually working?
For example:
-
Are CAPTCHA challenges being triggered when expected?
-
Are lockout or throttling mechanisms activating correctly?
-
Is the system slowing attackers down, or just recording failures?
So we treated bot and brute force signals the same way as other parts of authentication—not as external analytics, but as part of the flow itself.
This allows you to observe:
-
how automated attempts move through the system
-
where they are being stopped
-
and whether protection mechanisms are behaving as intended
Instead of just detecting attacks, you can now evaluate the effectiveness of your defenses in real time.
To Test It, We Ran It Through Multiple Real World Scenarios
Up to this point, the improvements sound structural. Cleaner models, better grouping, more explicit signals.
But the real test of a system like this isn’t how it behaves when everything is working.
It’s how quickly you can understand what’s happening when something isn’t.
Because in practice, most questions don’t start with curiosity. They start with pressure.
Scenario 1: A Sudden Increase in Login Failures
We simulated a sudden increase in login failures across a subset of users.
At first glance, the numbers looked concerning. Failure rates were clearly trending upward.
But what stood out immediately wasn’t the spike—it was the distribution.
Instead of a uniform increase, the failures were heavily skewed toward a single category:
- invalid credentials
MFA-related failures remained stable.
Policy enforcement didn’t change.
That ruled out:
-
system misconfiguration
-
MFA delivery issues
-
or overly aggressive policies
Within seconds, the problem space narrowed from “something is wrong” to “users are entering incorrect credentials more frequently.”
In a real-world situation, that distinction matters. It determines whether you:
-
investigate infrastructure
-
or simply monitor for potential credential stuffing patterns
Scenario 2: MFA Completion Drops Without Obvious Errors
Next, we tested a more subtle case.
We introduced friction into the MFA flow - not enough to break it, but enough to affect user behavior.
What we observed wasn’t a spike in failures.
Instead:
-
MFA challenges were being issued normally
-
delivery rates were consistent
-
but completion rates dipped
More interestingly, the drop-off was concentrated at a specific stage:
- after challenge delivery, before user interaction
This isolated the issue very clearly.
It wasn’t:
-
verification failure
-
or incorrect input
It was:
- users not engaging with the challenge
That points to a completely different class of problems—typically UX, timing, or channel reliability.
Without modeling MFA as a sequence, this would have appeared as a vague “MFA issue.” Instead, it was immediately localized to a specific step.
Scenario 3: Someone Attempted Low-Intensity, Distributed Attack
We then simulated a distributed attack pattern.
No large spikes. No single IP dominating. Just:
-
repeated failed attempts
-
spread across multiple accounts
-
over an extended period
Individually, these events didn’t look unusual.
But when viewed as flows, patterns started to emerge:
-
similar progression paths
-
repeated failure points
-
consistent retry behavior
More importantly, we could observe how the system responded:
-
where challenges were triggered
-
where attempts were blocked
-
and where retries continued
This wasn’t just detection.
It gave us a clear view into whether defensive mechanisms—like throttling and challenge triggers—were activating as expected.
Scenario 4: Someone Used Compromised Credentials in a Valid Login
In this test, we allowed a login attempt using a known breached password.
The authentication itself succeeded.
But the system surfaced something more important:
- the credential risk signal was attached directly to the flow
So instead of treating this as a normal success, it appeared as:
- a successful login with a high-risk indicator
From there, we could immediately:
-
identify the affected account
-
trace where the credential was used (login vs reset)
-
and assess exposure frequency
What stood out here wasn’t detection—it was timing.
The signal wasn’t delayed.
It appeared at the exact moment the authentication decision was made.
Which is what enables proactive response instead of post-incident analysis.
Scenario 5: Verifying Brute Force Protection Behavior
Finally, we tested how the system behaves under sustained brute force attempts.
We simulated repeated login attempts across accounts with controlled variations.
Instead of just counting failures, we focused on system behavior:
-
Were CAPTCHA challenges triggered at the right thresholds?
-
Did lockout mechanisms activate consistently?
-
Were retry patterns changing after enforcement kicked in?
Because these signals were part of the same flow, we didn’t have to infer effectiveness.
We could directly observe:
-
where the attack was being slowed down
-
where it was being blocked
-
and where it was still progressing
This turned what is usually a binary question—
“Are we protected?”
into something much more measurable:
“How well are our protections holding up under this pattern?”
What These Tests Confirmed
Across all scenarios, one thing became clear.
The improvement wasn’t just in visibility.
It was in how quickly a situation could be understood without any manual log parsing or scenario reconstruction.
We weren’t:
-
stitching logs together
-
writing queries
-
or interpreting ambiguous signals
The system already carried:
-
sequence
-
intent
-
and context
Which meant the time between:
👉 noticing something
👉 and understanding it
was significantly reduced.
Closing Thought: We Didn’t Treat This as Just Another Dashboard
It would have been easier to build this as a layer on top of existing logs.
Many systems do exactly that:
-
export data
-
build queries
-
visualize trends
But that approach assumes the underlying data model is already sufficient.
In our case, it wasn’t.
We weren’t missing charts.
We were missing structure.
So Security Analytics didn’t start as a dashboard.
It started as a change in how authentication itself is represented:
-
as flows instead of events
-
as outcomes with intent instead of generic states
-
and as something that can be understood in real time, without reconstruction
The dashboard is just where that becomes visible.
We would love to give you a free Demo so you can see it in action yourself! Click here to Book a Demo.