Have you ever stared at a 500 error spike during peak traffic and realized you have no idea what is actually causing it?
We've all been there. Managing an API ecosystem without deep visibility usually means you are guessing about peak loads, missing hidden security threats, or over-provisioning your infrastructure just to be safe. And that leaves devs with a constant fear of security threats and crashes.
To solve this, LoginRadius has rolled out Platform Analytics within the LoginRadius Identity Platform to turn your raw API logs into readable, actionable insights.
We wanted to move beyond basic monitoring and give everyone on the team the exact data they need to understand how the platform behaves under real traffic. So that devs now don’t have to do the guesswork - they get the raw data about their API performance and use it to find out the root cause of the issue.
What’s Inside Platform Analytics?
To make this level of visibility possible, we built a set of features that help you get to the bottom of performance issues fast:
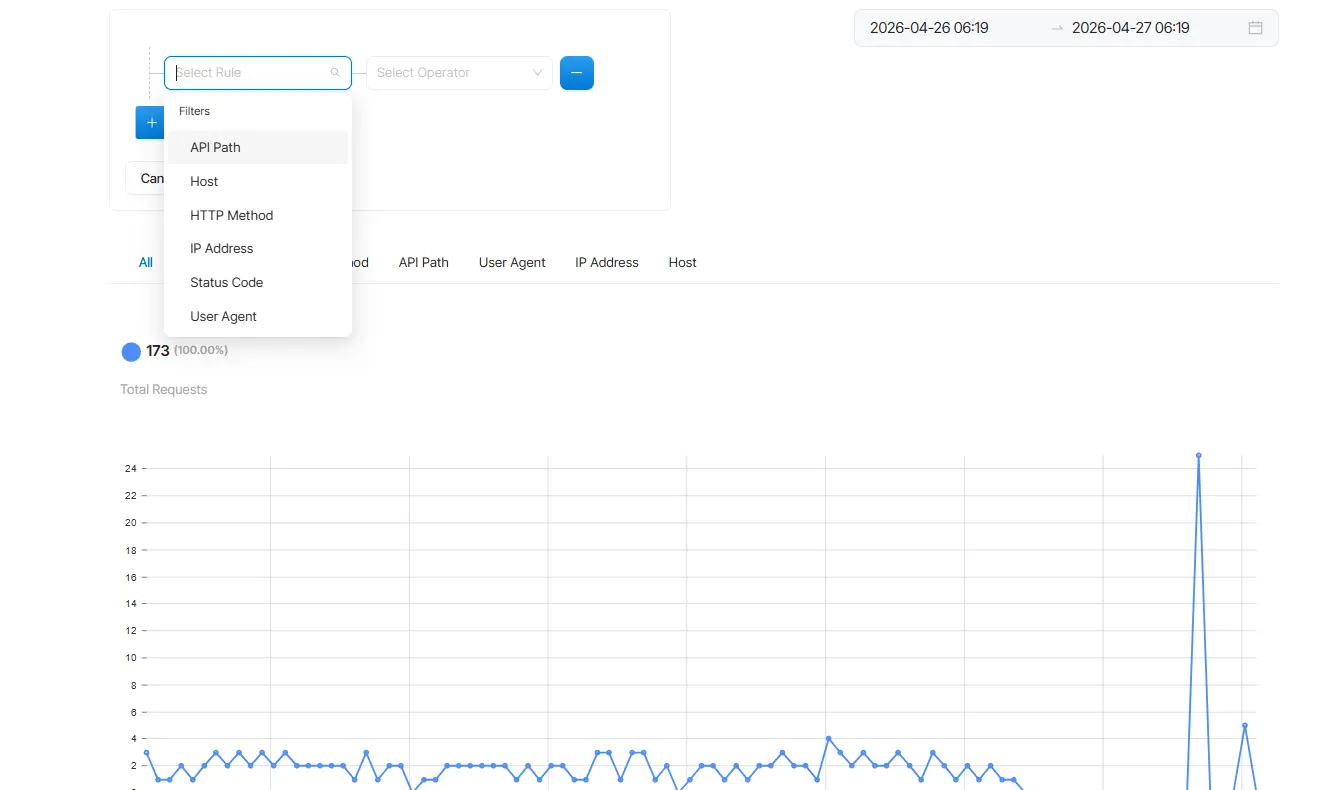
Deep Filtering for Active Troubleshooting
Basic charts are helpful, but we wanted to give you an active troubleshooting engine. You can apply powerful, active filters across the entire dashboard to drill down by Status Code, HTTP Method, API Path, User Agent, IP Address, and Host.
For example, if things break during peak traffic, you can instantly filter the data to show only 500 errors coming from /auth requests, pointing you directly to the root cause.
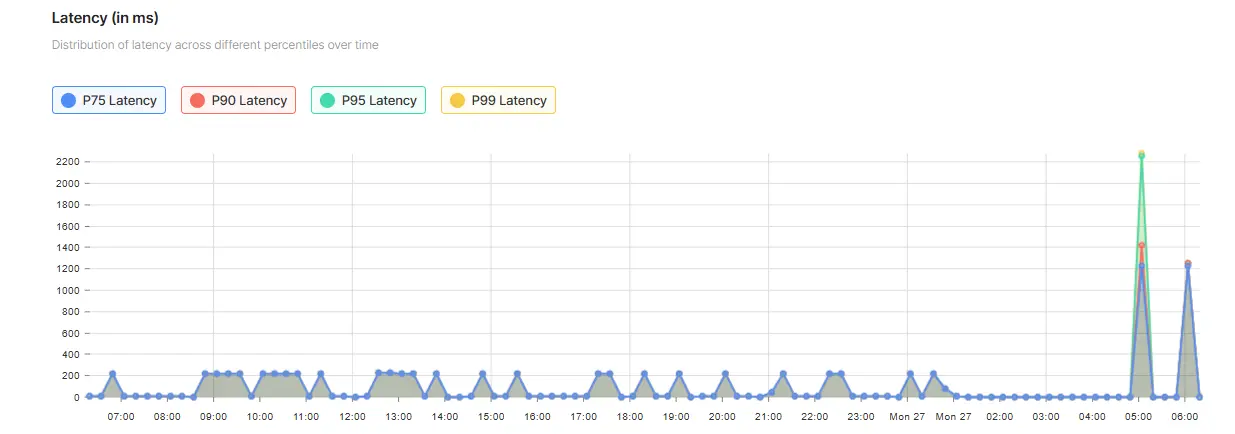
Advanced Latency Metrics (Because Averages Lie)
Average response times often hide the requests that are actually frustrating your users. To fix this, our latency graphs plot P75, P90, P95, and P99 percentiles.
This allows you to expose those rare, slow requests, helping you identify load-induced slowdowns and high-latency endpoints before your end-users even have a chance to complain.
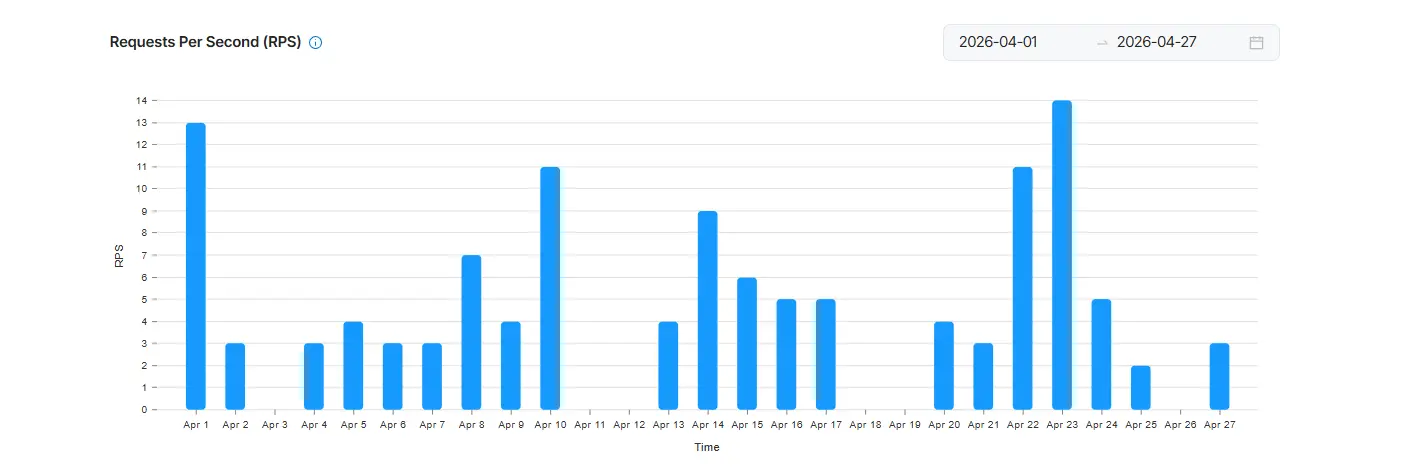
RPS (Requests Per Second) Analytics
To properly scale, you need to understand your system's actual throughput. The RPS Analytics section visualizes your Request Per Second patterns over a custom 1 to 30-day range.
You can track daily trends and see your exact Peak RPS (the maximum number of API calls processed in a single second). This gives you the hard data you need to confidently forecast scaling requirements, plan capacity, and optimize your rate-limit configurations.
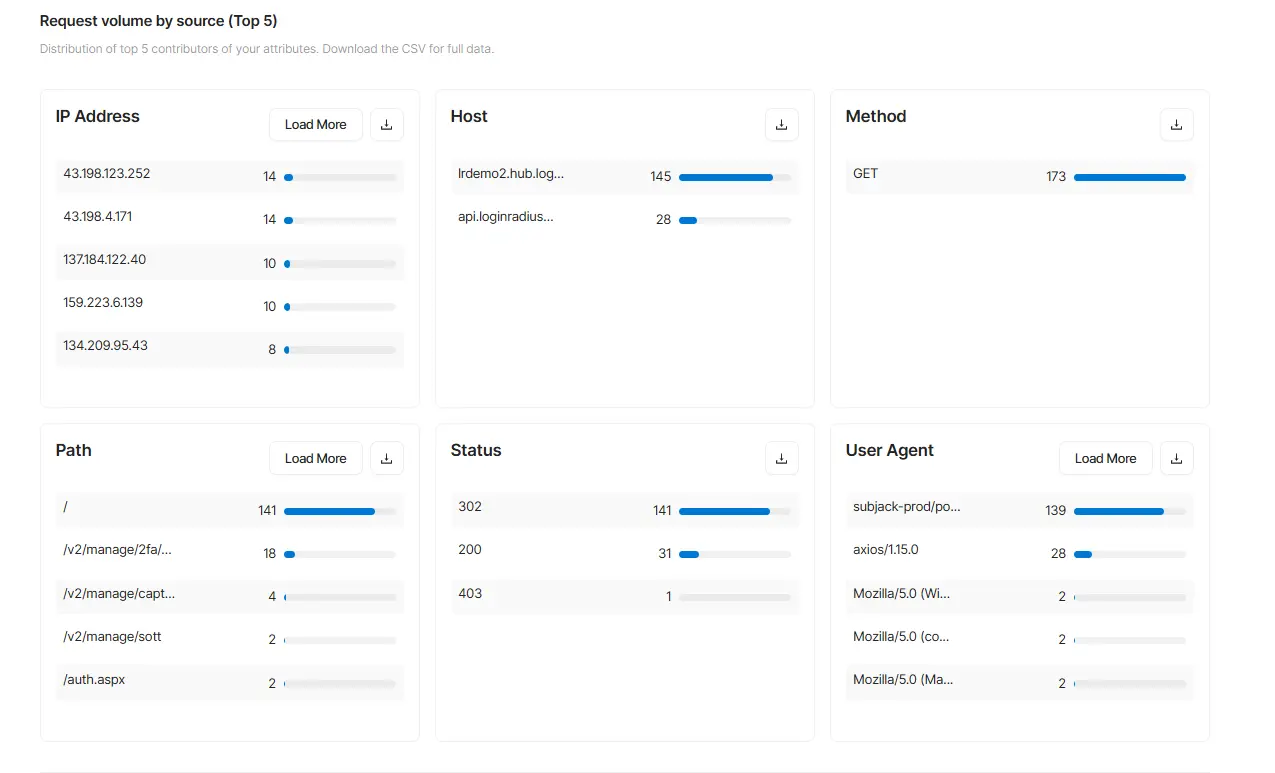
Real-Time Trends & Top 5 Breakdowns
The dashboard features near real-time refresh (every 5–15 minutes) with daily and hourly trend graphs for your traffic. Alongside this, you get "Top 5" breakdowns for your IPs, hosts, methods, endpoints, status codes, and user agents.
This makes it incredibly easy to spot anomalies - like realizing a single IP address is suddenly generating 74% of your traffic, which helps you catch abuse or broken integrations immediately.
One-Click Exports for Security and Compliance
When you need to share your findings, we made exporting effortless. You can download a full CSV of your raw data from any section—such as pulling an extended list of IP addresses to hand over to your security team for review.
You can also generate a complete PDF snapshot of your customized dashboard, preserving all your active filters, charts, and Peak RPS metrics for stakeholder presentations or compliance audits.
How It Benefits Your Team?
Now that you have all this data at your fingertips, how does it actually change your day-to-day workflow? Here are a few ways teams are using Platform Analytics to solve real problems:
1. Troubleshooting Errors Faster
Instead of playing a guessing game when an endpoint breaks or slows down, the dashboard shows you exactly where the errors are originating. You can instantly see the specific paths, IPs, or clients that are failing.
Whether it is a misconfigured integration or incorrect API usage, your devs can narrow down the issue and fix it in minutes.
2. Managing Traffic Surges and Seasonal Spikes
When a massive surge hits your backend, you need to know what is happening immediately. Whether it is a planned marketing campaign, a holiday sale, or an unexpected jump, you can quickly identify the traffic spike.
More importantly, by looking at the IPs and user agents behind the surge, your security team can instantly determine if it's a legitimate customer peak or a malicious bot attack.
This visibility allows you to prepare your infrastructure and avoid overload issues.
3. Tracking How Integrations and Clients Behave
If you have multiple systems hitting your APIs—like web apps, mobile apps, backend services, or partners—it can be hard to know who is doing what. With Platform Analytics, you can see exactly which applications or user agents are generating the most traffic. If one specific integration starts behaving unexpectedly or hogging resources, you will catch it right away.
4. Planning Capacity with RPS Analytics
Nobody wants to accidentally throttle their customers during a busy period. By understanding your actual Requests Per Second (RPS) patterns, daily peaks, and seasonal trends, you can confidently plan your capacity.
This allows your IT team to adjust rate limits intelligently and avoid hitting thresholds when it matters most.
5. Painless Compliance and Reporting
When it is time for a compliance audit or an internal security review, gathering data is usually a headache. Analytics gives you clean, easily exportable data.
Whether you need a monthly PDF snapshot of your dashboard or raw CSV evidence for a regulatory requirement, you can pull the exact data you need with just one click.
Real-World Use Cases: How It Actually Works in Practice
Let's look at how this data practically changes your day-to-day workflow when you are faced with real-world scenarios.
Case Study 1 - The Nightmare of Peak Traffic Hours
Picture this: It's your busiest time of the day, and suddenly your login API starts throwing 500 errors.
In the past, this meant your Slack channels blew up and you had to scramble, digging blindly through raw logs to guess what was causing the issue.
Now? With Platform Analytics, you just check the dashboard. You instantly see the error spike, identify the exact failing endpoint, and grab the specific IPs triggering the chaos. You fix the issue in a few minutes, close the ticket, and get back to your actual work instead of losing hours to guesswork
Case Study 2 - The Sudden Traffic Surge
Now imagine, out of nowhere, a massive, unexplained surge of traffic hits your infrastructure. Your heart drops a little - did marketing's new campaign just go viral, or is a malicious botnet trying to take you down?
Instead of waiting to find out the hard way, you immediately check the dashboard to see the specific IPs and user agents driving the spike.
If it looks sketchy, you can identify and block the suspicious activity long before it actually compromises your systems.
Ready to Stop Guessing?
It is time to move beyond basic monitoring and stop flying blind when it comes to your backend. Don't settle for surface-level data.
With LoginRadius Platform Analytics, you can finally take control of your API performance, troubleshoot with precision, and drive your product forward with intelligent insights.
If you are already using the platform, you can dive right in and start running your own filters by navigating to Admin Console → Insights → Platform Analytics.
Switch to LoginRadius to Experience the Difference! Want to see how this level of visibility can change your team's daily workflow? Book a demo today.